Representing an Equation in one variable on a graph


Representing an Equation in one variable on a graph
An equation in one variable can be easily represented on a number line by plotting the value of the variable on it. We can also represent the equation on a graph by considering the coefficient of the missing variable as zero, and then assuming the different values of the missing variable we can find the solutions and then plot the solutions on the graph.
Illustration: Plot the equation x= 4 on the graph
Solution: Let the coefficient of the missing variable be zero. The equation can be written as ; x + 0y = 4
For y=2 , the equation becomes x + 0(2)=4 or x = 4
For y=4 , the equation becomes x + 0(4)=4 or x = 4
For y=6 , the equation becomes x + 0(6)=4 or x = 4
So (4,2), (4,4) and (4,6) are the solution of the equation plotting them on the graph we get
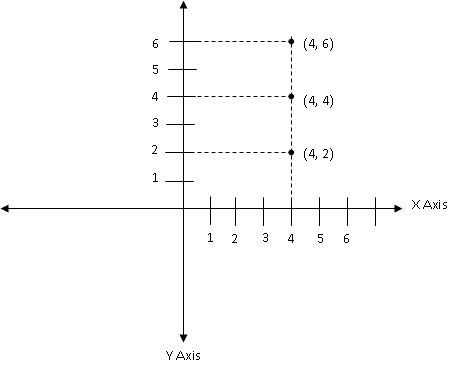
We get a line parallel to Y- Axis
Similarly if we plot the equation y=4, we get a line parallel to X- Axis
Write an equation of a line representing the y-axis | |||
| Right Option : A | |||
| View Explanation | |||
Write an equation of a line representing the x-axis | |||
| Right Option : B | |||
| View Explanation | |||
Identify the correct statement? | |||
| Right Option : B | |||
| View Explanation |
Students / Parents Reviews [10]
It was a good experience with Abhyas Academy. I even faced problems in starting but slowly and steadily overcomed. Especially reasoning classes helped me a lot.

Cheshta
10thA marvelous experience with Abhyas. I am glad to share that my ward has achieved more than enough at the Ambala ABHYAS centre. Years have passed on and more and more he has gained. May the centre flourish and develop day by day by the grace of God.

Archit Segal
7thI have spent a wonderful time in Abhyas academy. It has made my reasoning more apt, English more stronger and Maths an interesting subject for me. It has given me a habbit of self studying

Yatharthi Sharma
10thMy experience with Abhyas academy is very good. I did not think that my every subject coming here will be so strong. The main thing is that the online tests had made me learn here more things.

Hiya Gupta
8thMy experience with Abhyas is very good. I have learnt many things here like vedic maths and reasoning also. Teachers here first take our doubts and then there are assignments to verify our weak points.

Shivam Rana
7thBeing a parent, I saw my daughter improvement in her studies by seeing a good result in all day to day compititive exam TMO, NSO, IEO etc and as well as studies. I have got a fruitful result from my daughter.

Prisha Gupta
8thAbout Abhyas metholodology the teachers are very nice and hardworking toward students.The Centre Head Mrs Anu Sethi is also a brilliant teacher.Abhyas has taught me how to overcome problems and has always taken my doubts and suppoeted me.

Shreya Shrivastava
8thMy experience was very good with Abhyas academy. I am studying here from 6th class and I am satisfied by its results in my life. I improved a lot here ahead of school syllabus.

Ayan Ghosh
8thOne of the best institutes to develope a child interest in studies.Provides SST and English knowledge also unlike other institutes. Teachers are co operative and friendly online tests andPPT develope practical knowledge also.

Aman Kumar Shrivastava
10thIt has a great methodology. Students here can get analysis to their test quickly.We can learn easily through PPTs and the testing methods are good. We know that where we have to practice